GDBChart
Reading
data from the database.
3. Determine
the Chart Type and Characteristics
Chart Operations – the right-click menu
Add Ancestors and Add Descendents (general notes)
Saving Charts, and emailing them to others.
Introduction
The chart
program is a Windows program that is downloaded when you click one of the
[Charts] buttons or links: -
·
From
the Home Page (once you’re logged in): there is a link
![]()
·
When
you have opened a record in the genealogy database in page view: there is a
button [Charts]
·
Once
you’ve downloaded the Chart program an icon is put on your desktop. You can click this to re-run the program: -
![]()
Starting
the Chart program
For
the first time
1.
Click
the link “Genealogy Charts”, or a [Charts] button from page GDB2 (individual
record, page view)
2.
A
download page for FamNet/GDBChart appears. Click [Install].
3.
A
window “Opening GDBChart.Application” appears. Click [Run ClickOnce
Application]
4.
Windows*
checks that application prerequisites are installed on your computer, and
installs them if necessary. It then launches
the application: -
* GDBChart is
developed with Microsoft software, and may not work on older Mac or Linux
computers, but it will probably work on current models although this may depend
on installation options.
You are now
ready to start producing a chart by reading data from the GDB Database.
After
the first time
The
sequence above will have installed GDBChart, and its
prerequisites if necessary, on your computer. You can re-run the chart program
simply by clicking the icon, or clicking either the Genealogy Charts link or a
[Charts] button.
When the
program starts it will check the web site for updates, and if necessary
download an updated version of the program.
Reading data
from the database.
To read
chart data the process is (in summary): -
1.
Log
on
2.
Search
for your starting record
3.
Select
the type of chart that you want.
If you have
come from FamNet (either Genealogy Charts link or [Chart] button, you’re
already logged on, so you bypass step 1. If you have come from a [Chart] button your
starting record is already selected and you bypass step 2 as well.
1 Log on
You’ve
clicked the GDBChart icon on your desktop. After the system checks for updates (and will
download a more recent version of the program if I’ve updated the software) it
starts displaying a form with a button [Read Input]. Click this and the form “Get Chart Data”
opens: -
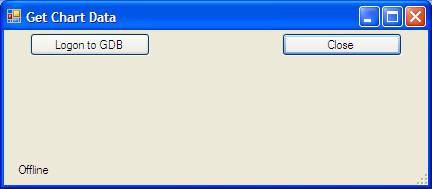
To use the
Chart program you must first logon, and you must be a current NZGDB
subscriber. Log on by clicking the
[Logon to GDB] button, and giving your GDB Userid and
password.
If you do
not have a current subscription, then the system will respond with a link where
you can subscribe, but will not log you into the Chart program: -
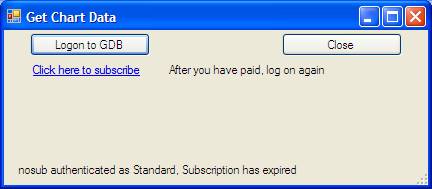
As with
registration, you pay a subscription on line, not through the Chart program.
If you log
on successfully, then the [Logon] button becomes [Log off] and [Search GDB]
appears. Click this.
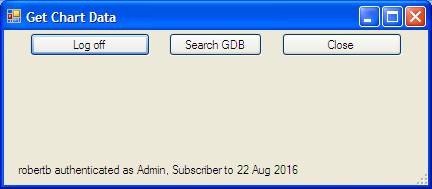
[Search GDB] makes the Find Record form appear
2. Find Records
You’ve
reached here from #1, or you’ve clicked the Genealogy Charts link from FamNet. You need to find the record that is going to
be the origin of your chart.
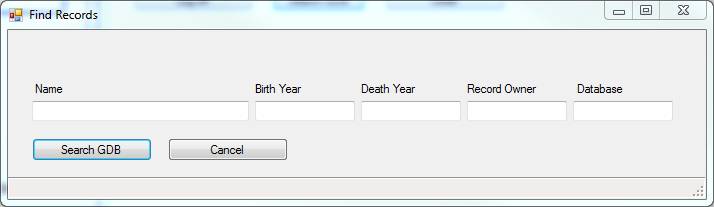
This works
in essentially the same way as an on line search.
·
Name. As with the FamNet search page, you can
enter the name as “Robert Barnes” or “Barnes,Robert”. If a
comma is present then the family name is whatever follows the comma and the
given name is whatever precedes it. If
there is no comma then the last blank is used to split the name into two parts. The given name may be omitted, but the family
name is required.
·
The
family name must be exactly found within the database, i.e. “McIntosh” finds
people with family name “McIntosh”, but not “MacIntosh”.
·
Given
Name or Initials. Optional. This gives part or all of the given
name(s). Thus “John” will return records
including “John Alfred”, “Alfred John”, “Johnathan”,
and any other variation that includes these four characters. If the given name is a single character, or
two characters separated by a blank or “.”, then the characters are interpreted
as initials.
·
Birth
Year. Optional. May be given as: -
o
a
single number, e.g. 1860
o
A
number pair, e.g. 1855-1865. This is
interpreted as “From 1855 to 1865 inclusive”, and will return records of people
born in the years 1855, 1856, 1857, 1858, 1859, 1860, 1861, 1862, 1863, 1864,
and 1865.
o
A
date, eg 24 Nov 1860.
This is checked to ensure that it is a valid date format, but only the
year is used: this will return records of people born on any date within 1860.
o
A
date pair, eg 1 May 1860 – 31 Oct 1862. This is interpreted as 1860 – 1862, ignoring
everything except for the year, and so will return records of people born from
1 Jan 1860 to 31 Dec 1862.
·
Death
Year. Optional. This follows the same rules as Birth Year.
·
Record
Owner. Optional. If given, then restricts records to those of
the particular owner
·
Database. Optional.
If given, restricts records to those from the named database.
You fill in
the search criteria and click [Search GDB] to have the records returned. Here, for example, we are looking for records
of J A PYM. As with the on line search, you will only see public records plus
your own private records, but you will not see other people’s private records.
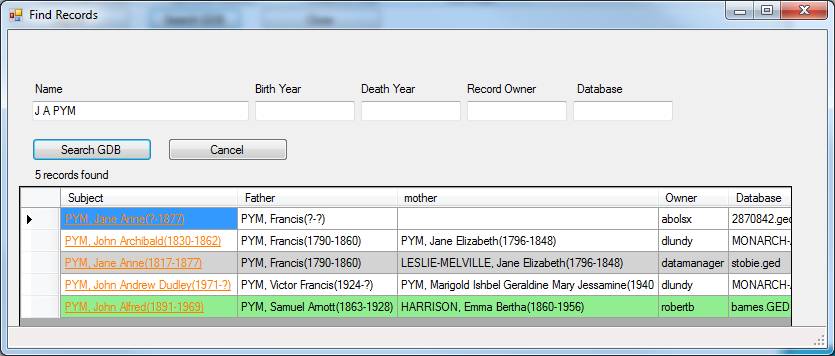
(As with
the on-line search, records are colour-coded: green indicates that the record has some
scrapbook entries).
Select a
record by clicking the link in the left-hand column. The list of records disappears, and then you
continue with the next process, specifying what kind of you want.
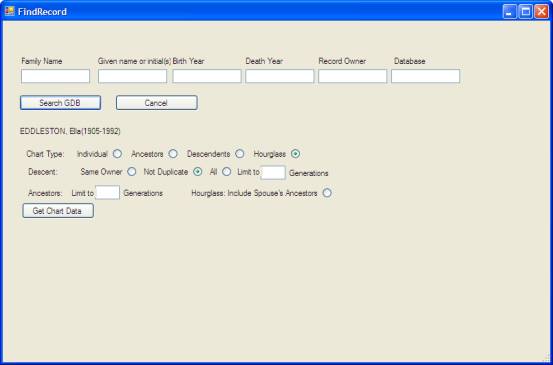
3. Determine the Chart Type and
Characteristics
You’ve
reached here from #2, or you’ve come here directly from a [Chart] button. However you reached here, you can repeat the
search if you wish by entering a name and clicking [Search GDB] again. In this example we’ve come from #2, having
selected the green John Alfred PYM record: -
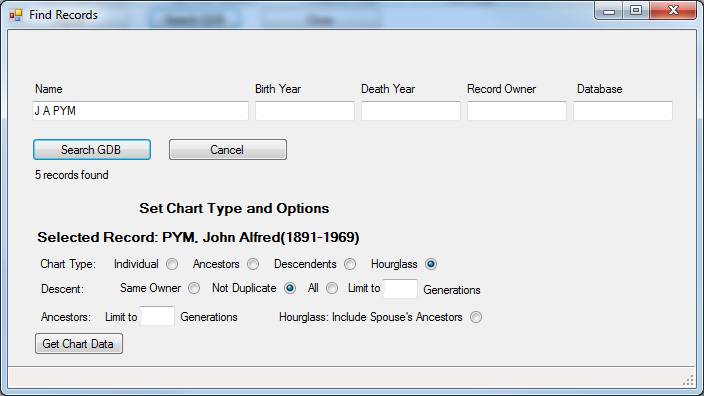
Chart
type: Most likely you will leave this as
the default, “Hourglass”, as this gives both the ancestors and descendents of
the selected person. However you can
select one of the other types.
When
charting descent and the tree is linked from sections owned by different
owners, then you may wish to choose whether to show all children, or restrict
yourself to children records with the same owner as the parent records. This is only relevant for linked trees: in
the vast majority of cases this is irrelevant, and it doesn’t matter which
value of this option you choose.
You can
limit the number of ancestral and descendent generations in order to keep the
chart small. If blank (or zero), then
there is no limit, and the system will attempt to retrieve as many records as
are in the database. If it takes too long,
then a window will appear asking you to set a limit. Typically it is descendent generations that
cause the problem.
Click the
option “Include spouse’s ancestors” if you want an hourglass chart to include
ancestors of both the subject (selected person) and his/her spouse(s).
When you
have selected the chart options, click [Get Chart Data] to retrieve the
required records and form the chart.
Data is retrieved following the same rules as the on line GDB: you will be able to see only public
information, the first generation of private data will be shown simply as
“Male” and “Female” with absolutely no details other than their existence and
gender, and you will not see further descent generations.
FamNet
retrieves the data that your chart needs and displays it.
Charts
Introduction
You can
resize charts, navigate around them, click any cell to
open the corresponding FamNet record, redraw the chart based on one of its
records, and so on. How to do this is explained below, but first a quick
overview.
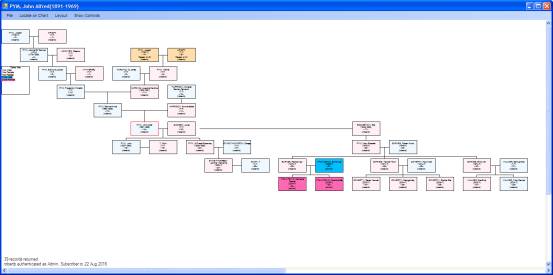
After
selecting PYM, John Alfred(1891-1969) and clicking
[Get Chart Data], the program displays this form: -
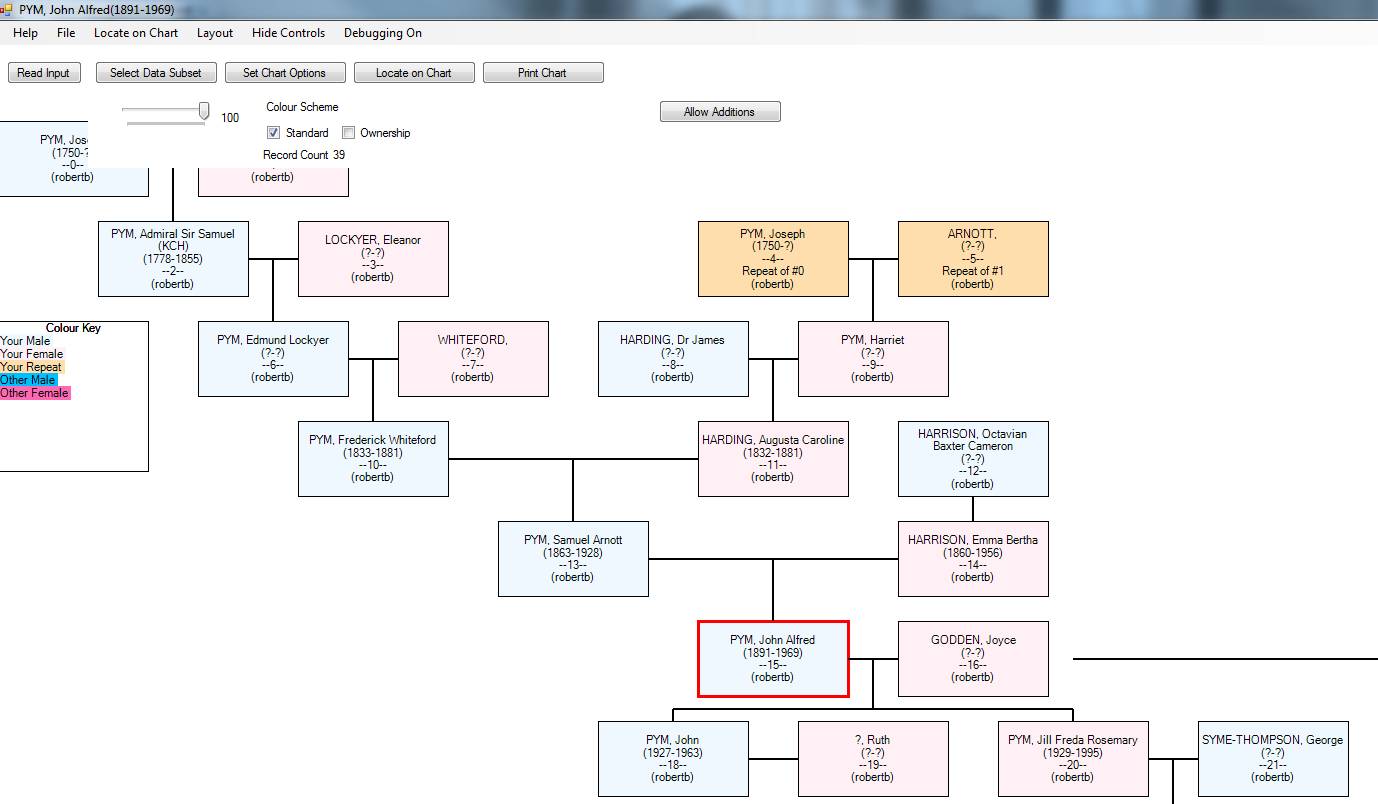
·
FamNet
works out the chart layout, using a row for each generation. See Genealogy
Charts below for more detail on the rules that FamNet applies.
·
You’ll
see that there some controls appearing towards the top – several buttons, a
slider to control the scale, and a couple of checkboxes to select a colour scheme. These
may obscure part of the chart, so you can click [Hide Controls] and they will
disappear.
·
Charts
often need several pages to display, so you can scroll vertically and
horizontally as necessary. In the case
of very large charts the top left page may be entirely blank as the ancestry
line determining how the chart height extends up from cells that are too far to
the right to appear on the first page. You
can scale the chart by dragging the slider to the left. With large charts you may need to use the
smallest scale (10%) to see their complete structure, but they’ll be unreadable,
but at the maximum scale (100%) you’ll only be able to see a small part at a
time.
Now let’s
look at some of the things you can do with a chart.
Open
a FamNet Record
Simply
click the cell. The corresponding record
will open in Page View.
Display
Another Chart
Right click
any cell on the chart. A menu appears: -
Click New
Chart and options appear as if you’d clicked the [Chart] button of this record. Thus it is very simple to draw charts for people
shown on this chart. Of course we can
click the button [Read Input] to restart from step
2 above.
Printing
a Chart
Just use
menu /File/Print, as you would with Word or other programs. See Printing a
Chart for more detail, including how to email a chart.
Menu
Options
File
Menu
File/Open. This will display the Get Chart Data form again, and you can search for
another record and display another chart. You will not need to log on again
unless you have logged off.
File/Close.
The form will be closed. This is
equivalent to clicking [X] at the top right.
File/Print Will open a dialog to print the chart.
File/Print Preview. Previews the printed chart.
File/Page Setup. Defines characteristics such as the paper size, which printer to use, etc.
Locate on Chart
This causes
this dialog to open: -
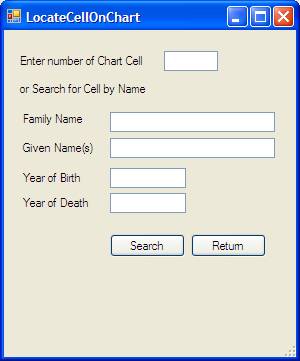
You can
enter the cell number, or the name of the person. The located cell will be highlighted with a
red border, and if necessary the chart will be scrolled so that the located
cell is in view.
Layout
Click this
to hide the chart and display a panel allowing you to change the chart
options. When you are through, click
[Set and close], and the chart will be re-displayed with the options that you
have set: -
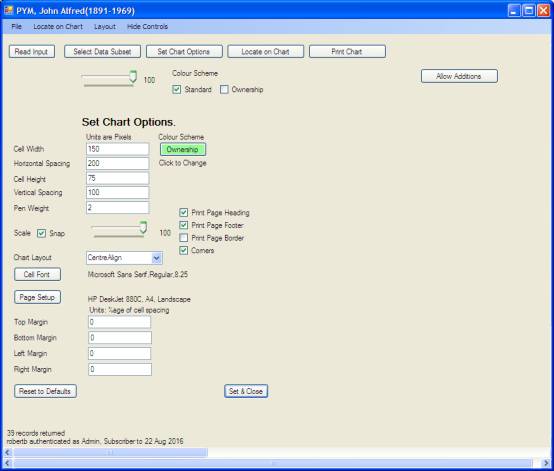
Cell width, Horizontal Spacing, etc determine the appearance of cells and lines on the chart. You might want to change these if you have ancestors with particularly long names, but normally you’d leave them with their default values.
Scale. You can display and print charts at less than 100% size. If snap is checked, then only values 10, 20, …. 90, 100% will be accepted.
Chart Layout. You will probably leave this as the default CentreAlign, but other options are Left, Right, and Centred.
[Cell font] allows you to set the font used for printing in cells.
[Page Setup] is identical in effect to the menu command File/Page Setup, allowing you to change paper size, printer, etc.
Margins: allows you to set the amount of margin space. The program will print in the margin to the limits allowed by the printer, but this printing will be repeated on the adjacent page.
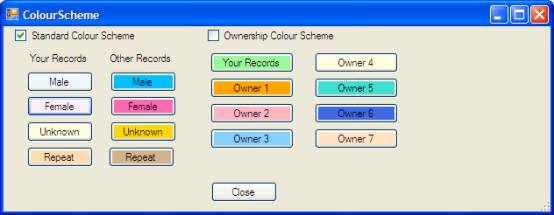
[Colour Scheme]. Click this button and a menu opens allowing you choose a colour scheme, and set its colours: -
Page numbering. A chart may be several pages wide and several deep. Pages are numbered “n,m”, eg “Page 2,1”, where n is the page down, and m is the page across. Every page is numbered, and pages are printed in order 1,1, 2,1, 1,2, 2,2, 1,3, 2,3, etc.
Print Page Heading: Causes the chart type and the name of the selected record, eg “PYM, John Alfred(1891-1989)” to be printed at the top of every top page.
Print Page Footing: Causes the page number and a footer: -
Printed at <time> from data downloaded from www.nzgdb.co.nz at <time>
This is printed at the bottom of every bottom page.
Page Border. If checked, a border will be drawn around the area of the page defined by its margins. Cells may be printed outside this area, but they will be repeated on adjacent pages.
Corners. If checked, a small cross is printed at the corners of the border area. This can be used to align pages when several sheets need to be pasted together.
Hide
Controls/Show Controls
Click this
and the chart controls will disappear, exposing the top of the chart that may
be obscured by them. Click the menu
again and they will re-appear.
Chart
Controls
The most
useful controls are available from buttons and other controls across the top of
the chart: -
[Read
Input]
Identical to the
File/Open menu. This will display the Get Chart Data form
again, and you can search for another record and display another chart. You
will not need to log on again unless you have logged off.
[Select Data Subset]
Click this
to display a dialog like this, that allows you to
limit the number of generations above and below the selected person: -
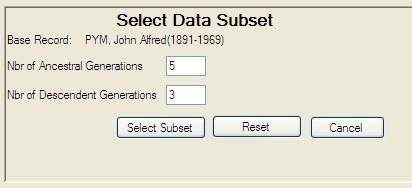
The chart
program will remove the unwanted data from the displayed chart, but it remains
in memory and can be very quickly re-displayed by clicking [Reset]. The program does not have to go back to the
database to either create the subset chart, or restore the full chart.
[Set
Chart Options]
Identical
to clicking the Layout menu, described above.
[Locate
on Chart]
Identical
to the Locate on Chart menu option, described above.
[Print
Chart]
Identical to the File/Print menu.
Chart
Scale
![]() This allows the chart scale to be
set without having to go through the Set Chart Options dialog. Chart scale can only be set to 10, 20, …100%, i.e. as if Snap has been set on, whether or not
Snap has been set. To set intermediate
scale value, use the dialog.
This allows the chart scale to be
set without having to go through the Set Chart Options dialog. Chart scale can only be set to 10, 20, …100%, i.e. as if Snap has been set on, whether or not
Snap has been set. To set intermediate
scale value, use the dialog.
Colour Scheme
![]() One of the colour
schemes can be chosen. You will need to
use the dialog if you want to actually select the colours
for the scheme.
One of the colour
schemes can be chosen. You will need to
use the dialog if you want to actually select the colours
for the scheme.
[Allow Additions]
In some
situations you can add further lines of ancestry or descent by right-clicking a
cell and choosing a command, “Add Ancestors” or “Add Descendents”. This does not always work, so this button
must first be clicked to enable the commands.
It displays a message warning you that this is an experimental facility.
[Accept]
[Undo]
These
buttons appear (and the button [Select Data Subset] disappears) when the
right-click menu commands “Add Ancestors” or “Add Descendents” is used. On clicking [Accept] the changes are accepted
into the chart, while Undo restores the chart to its previous appearance. These buttons disappear, the button [Select
Data Subset] reappears, and the Add Ancestors and Add Descendents commands are
re-activated.
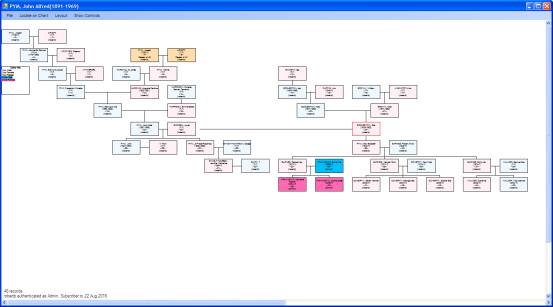
Genealogy Charts
In the
previous section Displaying a chart part of
an hourglass chart of PYM, John Alfred(1891-1969) was
shown at 100% scale. The top left part
of the chart was partly obscured by the chart controls, and of course you could
only see part of the chart. Here is the
complete chart at 50% scale, with the chart controls hidden: -
Chart
Colour Schemes
There are
two alternative colour schemes.
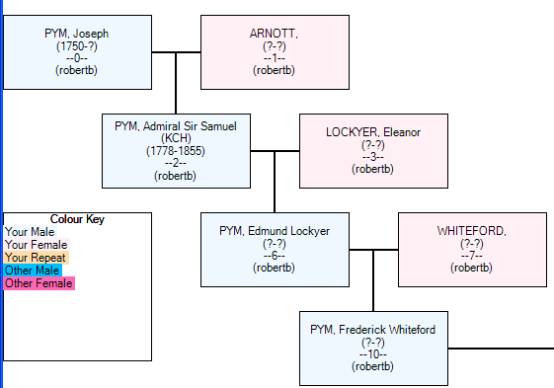
Here the chart is displayed with the standard colour
scheme, which distinguishes males and females, and between your records and
records belonging to other record owners.
Cells for repeated records are also distinguished: here PYM, Joseph(1750-?) and his wife ARNOTT,(?,?) appear in the
ancestry of both cell #2, PYM, Admiral Sir Samuel(1778-1855) and cell #9, PYM,
Harriet(?,?).
A colour key is printed to the left, positioned so that it
does not obscure any of the cells. The colour key here is: -
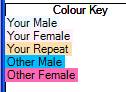
Colour keys contain only the colours that are used: in most cases you’ll see only “Your Male” and “Your Female”. If this had used the ownership colour scheme, then there are entries for each record owner in the chart: -
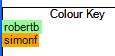
Chart Structure
A chart starts with the individual and his/her spouse(s): -
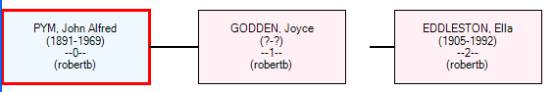
An ancestral chart will extend upwards with the ancestors of the selected person [and their spouse(s)]. A descent chart will extend downwards with the descendents of the selected person. An hourglass chart is a combination of both, with ancestors extending up and descendents down.
Cells are numbered by line from the left. Each cell is identified: -
Person’s name
Years of birth and death
Cell number
Record owner
If the cell repeats an earlier person, then a fifth line identifies this.
The chart program arranges cells so that each cell is as far to the left as possible provided that: -
It is at least one space to the right of the previous cell on the same row.
Parents are arranged evenly above their children
Children are arranged evenly below their children
Although these same rules apply to both ancestry charts and descendents charts, because an ancestry chart focuses on a single child they look different. This is the typical appearance of an ancestry chart: -
In the ancestry chart fathers are always to the left.
In contrast, this is a typical family within a descendents chart: -
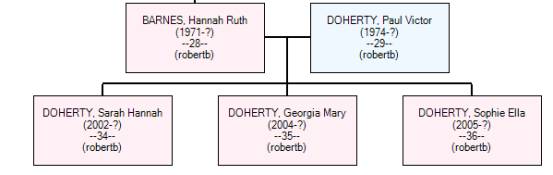
Records here are arranged with the descendent on the left, and their spouse(s) on the right, so here we have the mother on the left.
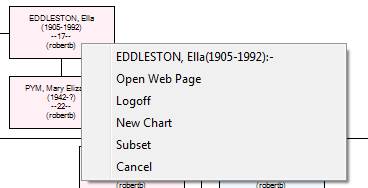
Chart Operations – the right-click menu
Right-click a cell, and a menu appears: -
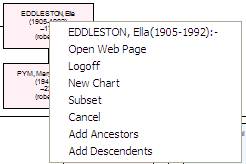
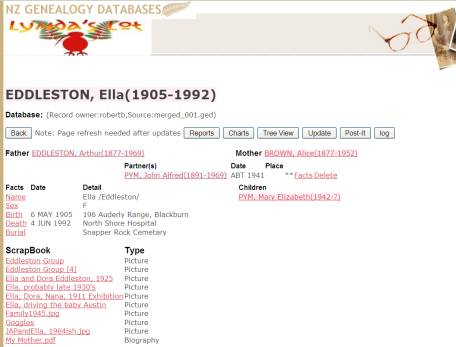
Open Web Page.
Select this option, or simply click the cell, to open the web page: -
Logoff
Click this to log off and continue working offline. You will need to log on again if you want to read more data from the GDB database.
New Chart
The Find Record form is displayed with the clicked record already selected: -
You can simply click [Get Chart Data] to display a new chart based on this record. Alternatively you can do another search, clicking [Search GDB] and then creating a new chart from somebody entirely different.
Subset
This displays the [Select Data Subset] form, as if you had located this record and then clicked the chart control button.
Cancel
Closes the menu
Add Ancestors and Add Descendents (general notes)
To make these commands available you must first click [Allow Additions].
It displays
a message warning you that this is an experimental facility. When you click this, the
commands “Add Ancestors” and “Add Descendents are added to the right-click
menu.
You may not
be able to use these commands (see notes below), and they may not always
work. Consequently, once you use either
of these chart control buttons [Accept] and [Undo] will appear (and [Select
Data Subset] will disappear), and you will not be able to use either Add menu
command again until you have clicked either [Accept] or [Undo].
Add
Ancestors
For most of
an hourglass chart this command is of little use. All of the ancestors of the starting person,
all of his ancestors, and all of his descendents, are already in the chart, so
there would be nothing to add. If you
use this command with one of these cells then you’ll just get a message.
Where the
command could be useful is from a spouse of the starting person. This you can add ancestors to his spouse Ella
Eddleston: -
However adding spouse ancestors of children is usually prohibited, as it
would result in crossing lines and a messed up chart.
Thus in this family the only ancestors that could be added are of Samuel
Paul Walker, as this is the rightmost cell on this level.
If you have
restricted the number of ancestral generations, then this command may be useful
on the top line of a tree to selectively add further ancestral generations.
Add
Descendents
This is
more flexible than Add Ancestors as it is often possible to extend lines of
descent. In particular, you may develop
a tree starting with an hourglass from some individual, then
extend down some selected lines by adding the descendents of one of the
ancestors.
Printing a Chart
Charts can
be printed simply by clicking the button [Print Chart] or the menu File/Print,
and following a standard print dialog.
Charts are printed with whatever scaling and colour scheme has been chosen. Of course even at reduced scaling many charts take more than one page to print, especially as few of us have printers handling large sheets of paper or continuous rolls. Default page size is usually A4, landscape orientation. A chart may require several A4 sheets, both to cover the width and to cover the height of the chart.
Pages are numbered across and down, with pages identified by column and height. For example, suppose a chart takes three pages across, and two down, to print. Pages will be labelled “level, across”, i.e. 1,1, 1,2, 2,1, 2,2, 3,1, 3,2:-
Page headings
The top of every level-1 page carries the heading, which is the original chart type and the “Namedate” of the original starting person, e.g.
“Hourglass, PYM, John Alfred(1891-1969)”
Note that if you might have started here (or with an ancestry or descendents chart) and then added more people with Add Ancestors and Add Descendents, so that this is no longer an accurate description. However the title only changes when you restart by clicking the [Read Data] button or the New Chart right-click menu.
Page Footing
The bottom of every lowest-level page (level 2 in the example above) carries a footing like this: -
Printed at <time> from data downloaded from www.nzgdb.co.nz at <time>
Reprinting part of a chart
A standard print dialog is used, so as far as this is concerned the chart above has 6 pages. If you want to reprint part of it, you give the From and To pages in terms of their printing sequence. Thus if you ask to reprint pages 3 to 5, you will print pages labelled by GDBChart as 1,2, 2,2, and 1,3.
Saving Charts, and emailing them to others.
You can save a chart by printing it to PDF. A free PDF printer can be downloaded from http://www.pdf995.com/. Once saved as a PDF, it can be stored in your computer, or emailed to others.
If you want to share the live chart with others, then they have to be subscribers to the GDB, and if your chart includes your private records then they will not see these people unless you have given them permission to see your private records in the GDB.